Learn what mode, median, and mean, well, mean in this informative and approachable article.
Study Statistics
Discover articles that turn statistical challenges into successes with captivating content aimed at boosting students' statistics skills.
Understanding data and patterns is super important, right? That’s why it’s great to learn how to look at data, read graphs, and more. DreamBox has fun resources to help you get really good at statistics and prepare you for cool topics like probability and data science.
Browse Most Popular Articles:
Learning how to work with equations makes you a better problem-solver and gives you tools to tackle challenges you may face in school and in life.
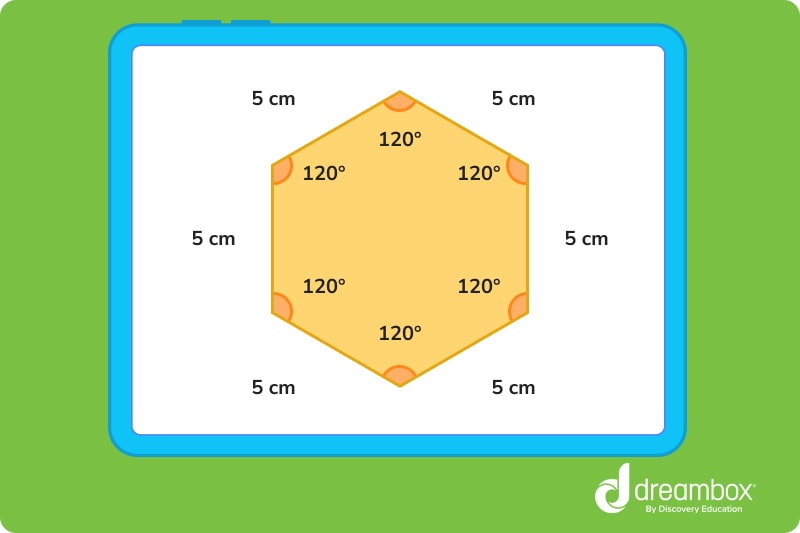
A hexagon has six sides – They are two-dimensional closed figures, and they can be oddly shaped, so long as their sides add up to six.
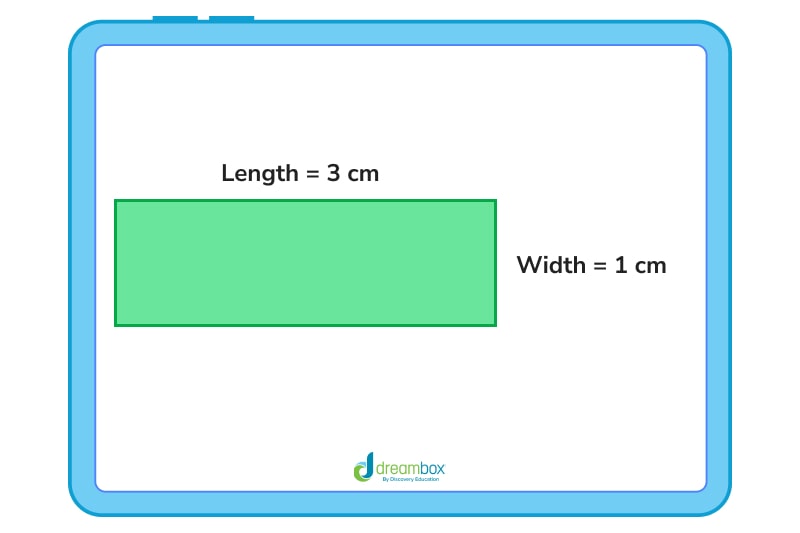
A rectangle is a four-sided closed shape with equal parallel sides – A square is always a rectangle, but a rectangle is not always a square!
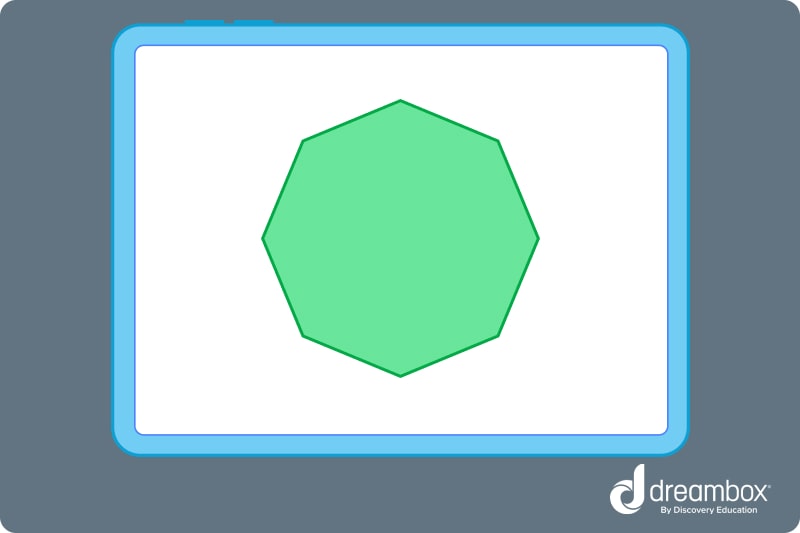
An octagon is a shape with 8 eight sides – It’s actually a type of polygon, which is typically a shape with at least three sides.
Browse All Statistics Skills:
Practice makes perfect. Work through statistics problems or use our guides to refresh your mind and master statistical concepts!
Finding the IQR or interquartile range is a snap once you know a few simple steps.
FAQs About Statistics
Statistics is a branch of mathematics that deals with collecting, analyzing, interpreting, presenting, and organizing data. Here are some key points to help you understand statistics better:
- Data Collection: This involves gathering information from various sources, such as surveys, experiments, or observations.
- Data Analysis: Once the data is collected, it is analyzed to find patterns, trends, or relationships. This can involve calculations like averages, percentages, or more complex statistical tests.
- Interpretation: After analyzing the data, statisticians interpret the results to draw conclusions or make predictions.
- Presentation: The findings are then presented in a clear and understandable way, often using charts, graphs, or tables.
- Organization: Organizing data helps in making it easier to understand and use for further analysis.
The mean is a measure of central tendency in statistics, often referred to as the average. Here’s how you can understand and calculate it:
- Definition: The mean is the sum of all the values in a data set divided by the number of values.
- Calculation: To find the mean, you add up all the numbers in your data set and then divide by the total number of values. For example, if you have the numbers 2, 4, 6, 8, and 10, you would add them up to get 30, and then divide by 5 (the number of values), resulting in a mean of 6.
The median is another measure of central tendency in statistics, which represents the middle value in a data set. Here’s how you can understand and find the median:
- Definition: The median is the value that separates the higher half from the lower half of the data set.
- Calculation:
- Odd Number of Values: If your data set has an odd number of values, the median is the middle number when the values are arranged in ascending order.
- Even Number of Values: If your data set has an even number of values, the median is the average of the two middle numbers when the values are arranged in ascending order.
The mode is another measure of central tendency in statistics, which represents the most frequently occurring value in a data set. Here’s how you can understand and identify the mode:
- Definition: The mode is the value that appears most often in a data set.
- Calculation: To find the mode, you simply look for the value that occurs the most frequently. A data set can have:
- No Mode: If no number repeats.
- One Mode: If one number repeats more than any other.
- Multiple Modes: If two or more numbers repeat with the same highest frequency.
Grades
If you’ve ever wondered how to help your child with math homework or what they should know by the end of fifth grade, these elementary math resources are for you.
Choose a grade level below to browse math skills and objectives by grade.
It’s time to build on what we’ve learnt so far and develop mathematical fluency.
Level up number knowledge with the introduction of multiplication, division and fractions.
Classifying, analysing and problem-solving: we’re applying all our skills here!
Understanding is extended even further across number, measurement and geometry.
Meet ratio, rational numbers and equations – this is where we explore statistical thinking.
Children learn more advanced topics like pre-algebra and investigate complex statistics and probability.
Introduce problems involving shape, scale drawings, population samples and more.
Take at home math practice to the next level
Empowering parents and educators to make math practice more impactful. Plus, your kids will love it.