How to Use a Multiplication Chart
Use this guide for a straightforward approach to understanding multiplication charts, an essential tool to hone your child’s multiplication skills.

Author
Michelle Giczika
Published:
March 2025
Key takeaways
- • Multiplication charts are practical, hands-on tools that promote children’s understanding and memorization of their times tables.
- • Reading a multiplication chart is as simple as spotting your desired numbers and identifying where they intersect.
- • Use our free downloadable multiplication chart to practice at home.
Is your child starting with multiplication? If so, a multiplication chart might just be their new best friend. This friendly chart is nothing more than a grid, but it’s a grid that shows multiplication facts in a clear, easy-to-understand way. It’s a practical tool that presents multiplication facts in a format that’s easy to follow, aiding children in their understanding and memorization of multiplication principles. You might say, a multiplication chart takes the mystery out of multiplication.
What is a Multiplication Chart?
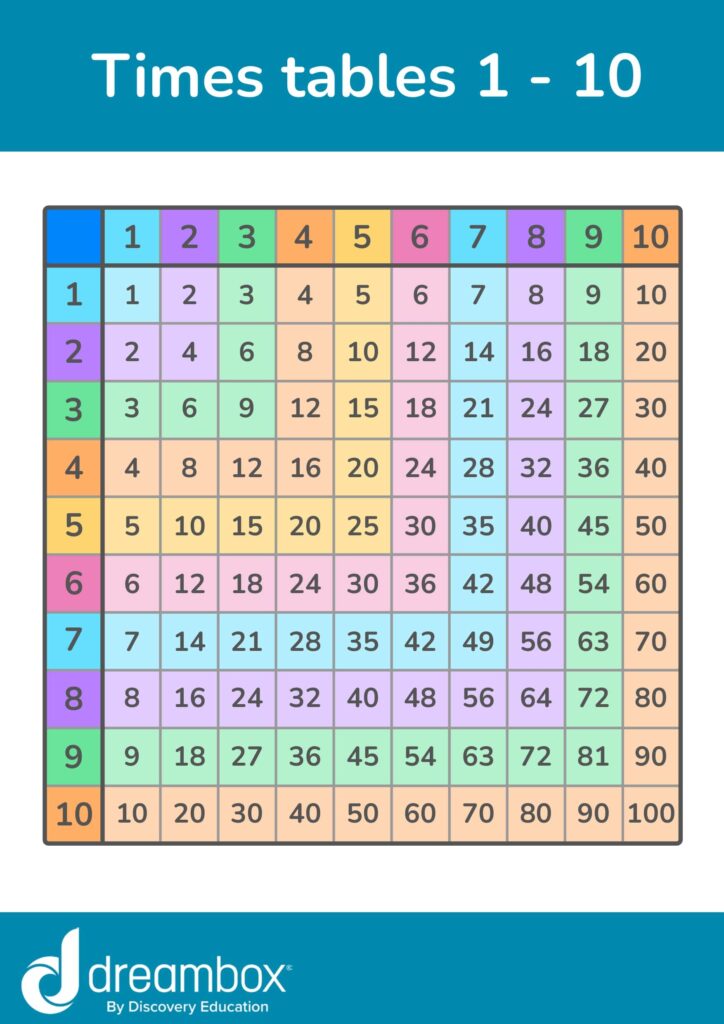
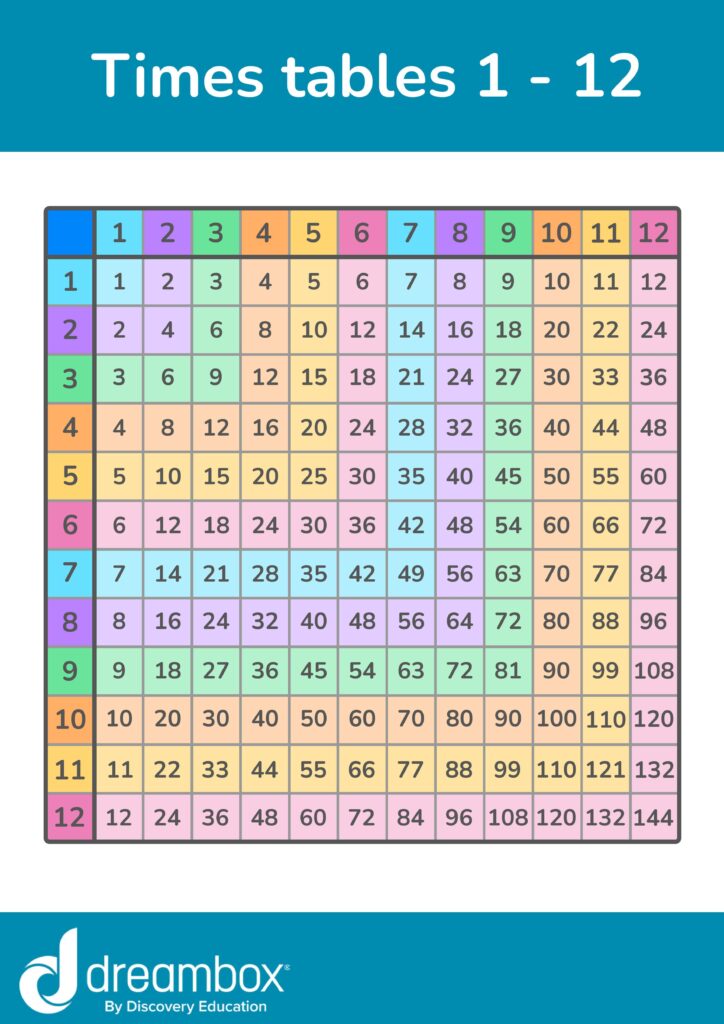
A multiplication chart, often called a times table or multiplication table, is a grid that illustrates the result of multiplying pairs of numbers. The chart is designed as a grid that displays columns of consecutive numbers across the top and rows of consecutive numbers to the left. You can find the product of two numbers (aka factors) by tracing where they intersect on the grid.
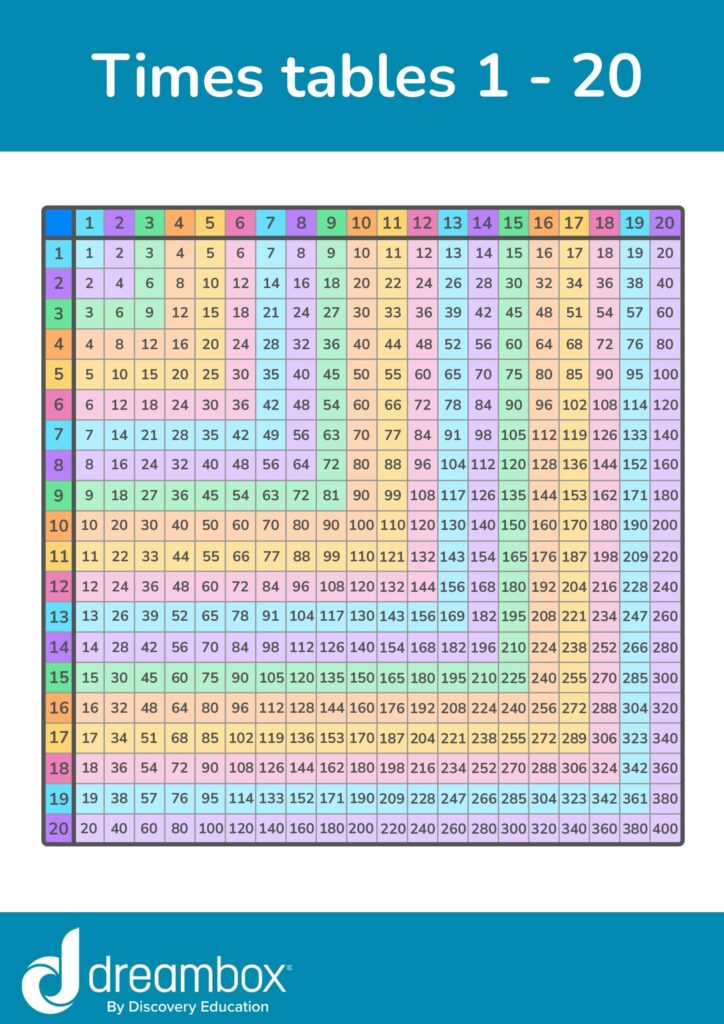
Table of contents
Get math practice with DreamBox!
Turn math into playtime with DreamBox Math
DREAMBOX MATH
Get started for FREE today!
How to Read a Multiplication Chart
Reading a multiplication chart or timetable chart might seem overwhelming, but it’s pretty simple. Let’s break it down:
- Locate the numbers: The first step to using a multiplication chart is identifying the numbers you want to multiply. These will be listed down the left side (rows) and across the top (columns) of the chart.
- Find the intersection: Once you’ve identified the two numbers you’re multiplying, follow the row of the first number and the column of the second number. The point where the row and column intersect on the chart is the result of the multiplication.
So, if you were trying to solve 7 x 8 on a multiplication chart, you would find the number 7 on the left-hand side and follow that row across to the right until you come to the eighth column. Where the two numbers meet is where you’ll see the answer – 56.
The process gets even easier with more practice. Remember, like any other skill, mastering multiplication takes time, so be patient with your child and offer plenty of encouragement as they learn.
Free Printable Multiplication Charts
Practicing multiplication is the secret to getting better at it. That’s why we’ve got a variety of multiplication chart printables ready for you to use. Whether your child is starting with multiplication or ready to tackle bigger challenges, a printable multiplication chart here is right for them.
Multiplication Chart 1-10
Multiplication Chart 1-12
Multiplication Chart 1-20


The math program that drives results
Get started today!
DreamBox adapts to your child’s level and learning needs, ensuring they are appropriately challenged and get confidence-building wins.
Practice Problems
Click on the boxes below to see the answers!
Associative Property of Multiplication
- (2 * 3) * 4 = 24
- 5 * (3 * 4) = 60
- (7 * 2) * 3 = 42
Commutative Property of Multiplication
- 7 * 6 = 42; 6 * 7 = 42
- 8 * 3 = 24; 3 * 8 = 24
- 2 * 9 = 36; 9 * 2 = 18
Distributive Property of Multiplication
- 3 * (4 + 2) = 18
- 5 * (6 + 3) = 45
- 2 * (5 + 7) = 24
Identity Property of Multiplication
- 9 * 1 = 9
- 1 * 6 = 6
- 5 * 1 = 5
Zero Property of Multiplication
- 8 * 0 = 0
- 0 * 5 = 0
- 3 * 0 = 0
FAQs about multiplication charts
A multiplication table for kids is a tool that displays the results of multiplying two numbers together. It’s arranged in a grid format, visually representing the concept of multiplication, and helps kids better understand and memorize these basic math facts.
We use a multiplication chart or time table chart because it’s an excellent visual aid that simplifies the learning of multiplication. It provides a quick reference for multiplication facts and aids in understanding the patterns and relationships between numbers. This ultimately helps children to develop their number sense and mathematical reasoning skills.
Reading a multiplication chart involves finding the values you wish to multiply along the top row and the first column, then following the row and column of these numbers until they intersect. The value at the intersection point is the product of the multiplication.
Creating a multiplication chart starts by writing the numbers 1 to 10 or 1 to 12 (depending on the chart size you want to make) across the top row and down the first column. Then, fill in each cell in the chart by multiplying the number from its row by the number from its column. So, for example, the cell at the intersection of row 3 and column 4 would contain the number 12 since 3 times 4 equals 12. Repeat this process for all the cells in the chart.
Take at home math practice to the next level
Empowering parents and educators to make math practice more impactful. Plus, your kids will love it.


